STREAMLIT PILLED
Introduction⌗
Streamlit is a really sick open source python framework that (frankly) saved my life. Founded in 2018, it’s a relatively new player in a space that honestly really needed something like this. It lets python developers create sleek data apps (aka mostly data viz // science focused web apps). While the python world has had flask and django and all these other frameworks and libraries, they were not nearly as developer friendly. The key thing about it all is that the “developer” in the case of Streamlit can mean so many types of users, as opposed to the other frameworks. Streamlit is so intuitive that data scientists, analysts, or even an enthusiastic PM can pick it up and get value out of it with a much kinder learning curve than flask or something else.
Streamlit’s key values focus on speed and interactivity. The concepts behind the framework are all about embracing scripting and the idea of widgets to add interactivity (i.e. a widget for a file uploader vs a widget for a calendar picker). In short, it takes everything that a python developer is already used to and adds a layer of front end capabilities that are simple to adopt and powerful when used.
Before going further, I want to give a huge s/o to Tyler Richards (@ tylerjrichards), the author of the great book, Getting Started with Streamlit for Data Science. He’s the one that originally put me on to the framework (I saw his tweets) and a great data scientist. His book is the best place to get started if you’re interested in learning how to use Streamlit and I cannot recommend it enough (Disclaimer: he is my friend).
With all that said, I’ll jump into the actual Streamlit things I wanted to put out into the void.
Brief Overview⌗
Over the past 10 months, I’ve been working on an ML project focused on extracting text from source images and transforming that text into a final file format based on some client requirements. During the course of this project, we ran into a snag with the final step of taking the output of the text extraction algorithm and shaping it into valid format for final delivery. Everything around this project is fairly private for some NDA reasons, so this post won’t focus on much of the ML part of it. HOWEVER, what I can (and do ) want to chat about is how we fixed that particular snag in the project…..Enter Streamlit!
Projects I’ve done⌗
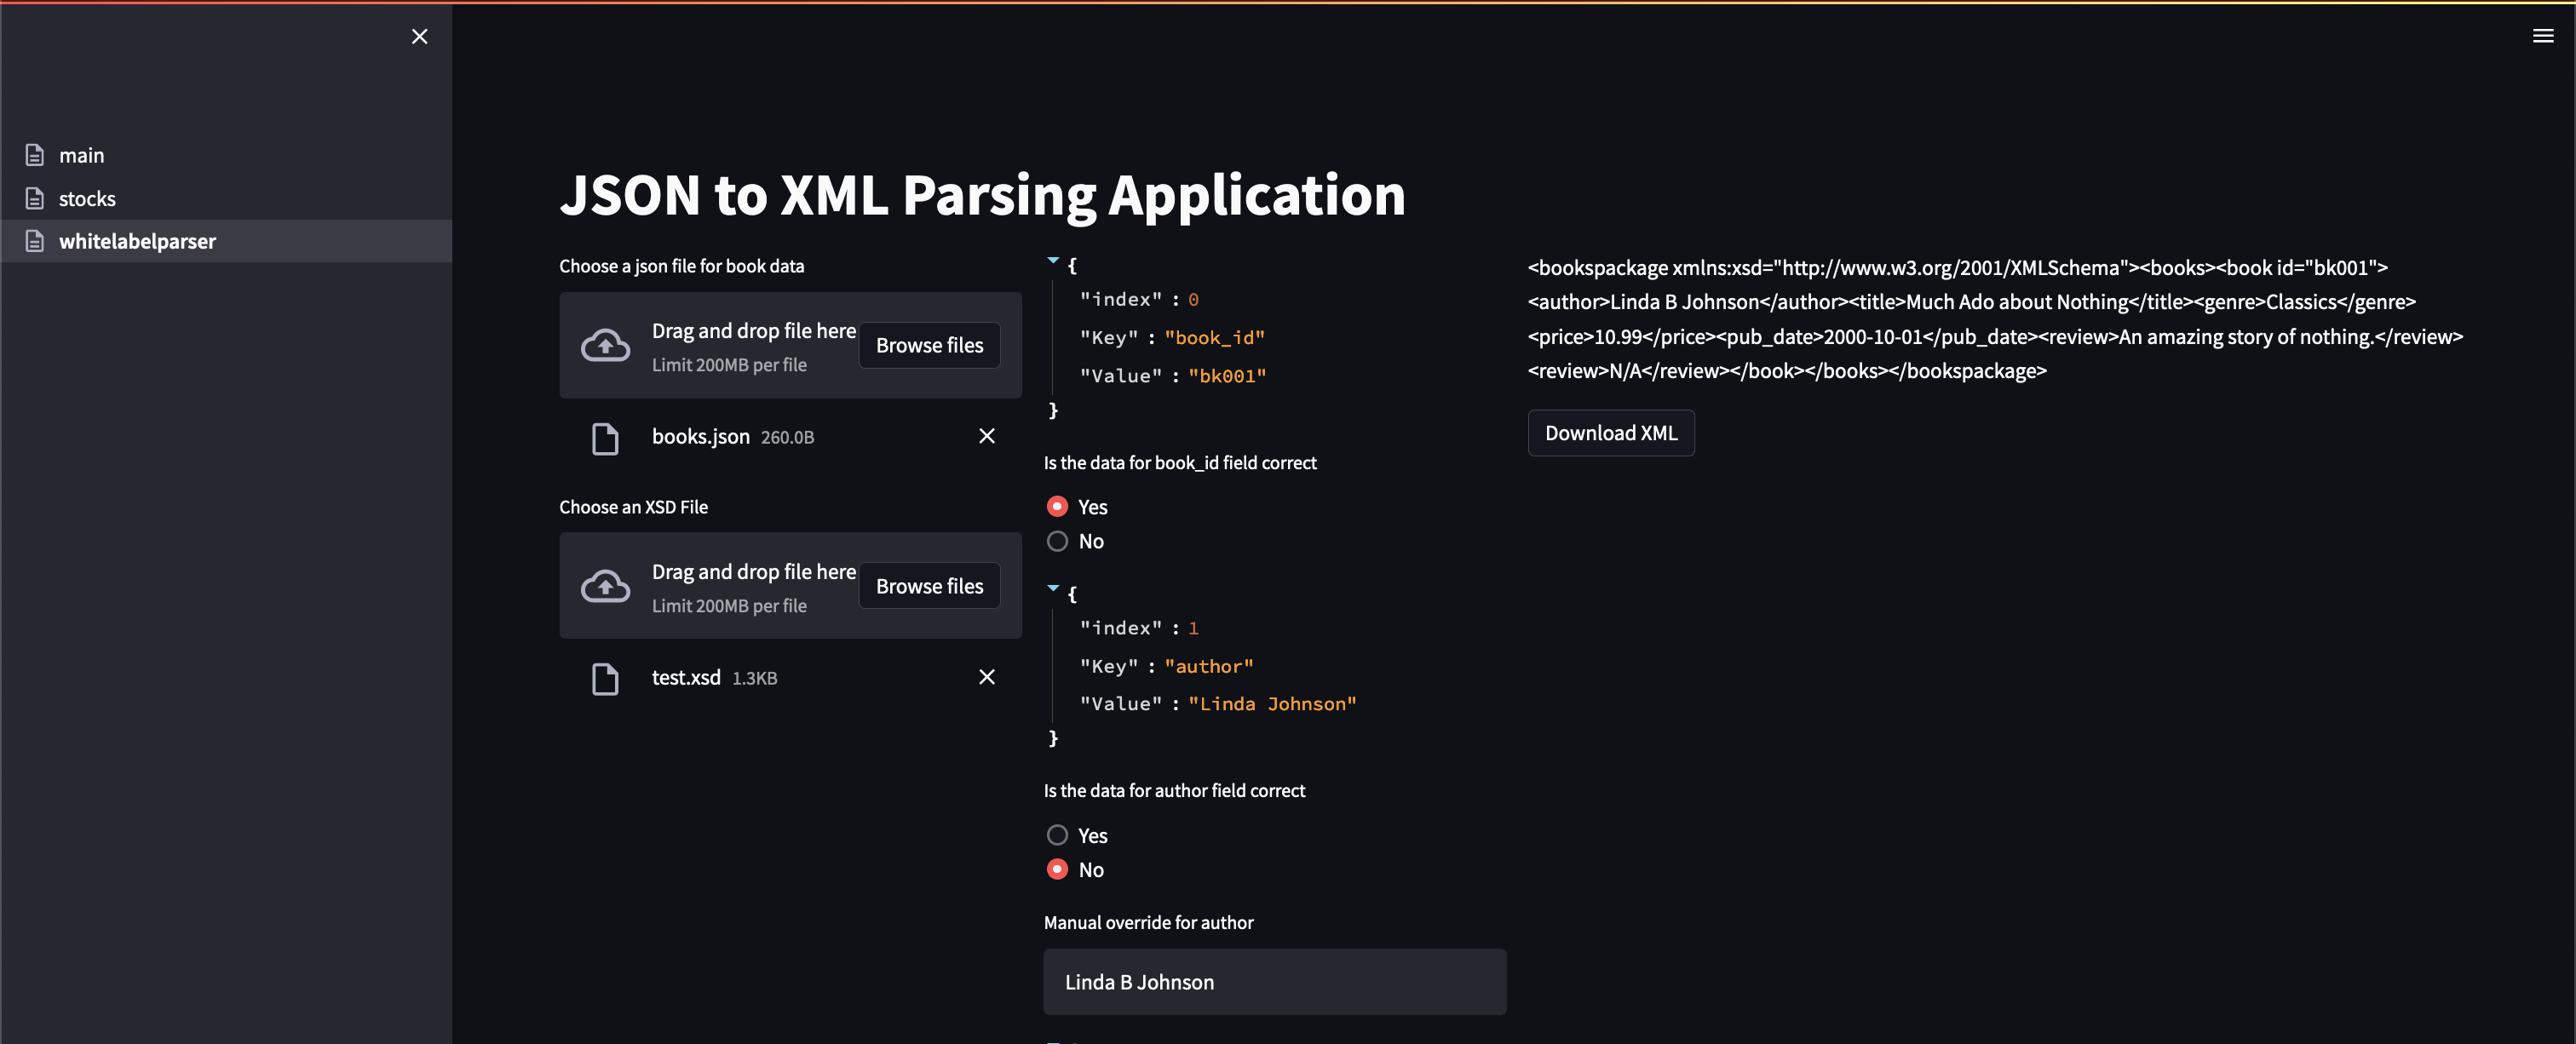
- Sample JSON to XML parser and validator
I mentioned above that the project that kickstarted my interest in Streamlit is relatively private, so I can’t really show off the application I developed (the data and requirements pretty much would give away the project context and that’s no bueno). However, I can show off a simplified version using (made up) data that is v different than the actual project and focus on some of the techniques I used.
The main goal was to create a user interface where a user could load some JSON files, see the data in the files + edit if needed, then form an XML that would be validated against an accompanying XSD file.
Most of the hard work during the actual project I mentioned in the intro was the data wrangling and cleaning needed before final client delivery, mostly due to the variety of conditions and transformations the source data needed. On the flip side, this demo’s focus is all the other stuff I needed my app to do and how Streamlit allowed me to easily create these other parts that would otherwise require an actual front end developer and some javascript to do (file uploading, presentation of the data, prompts for user input, etc). The fact that I was able to get those aspects of the application set up quickly allowed me to focus on the really hard aspects, which like I mentioned, was the business logic and data transformations that the client requirements specified. Streamlit literally saved me so much time and effort that I am now fully streamlit pilled.

- Interactive Dashboard
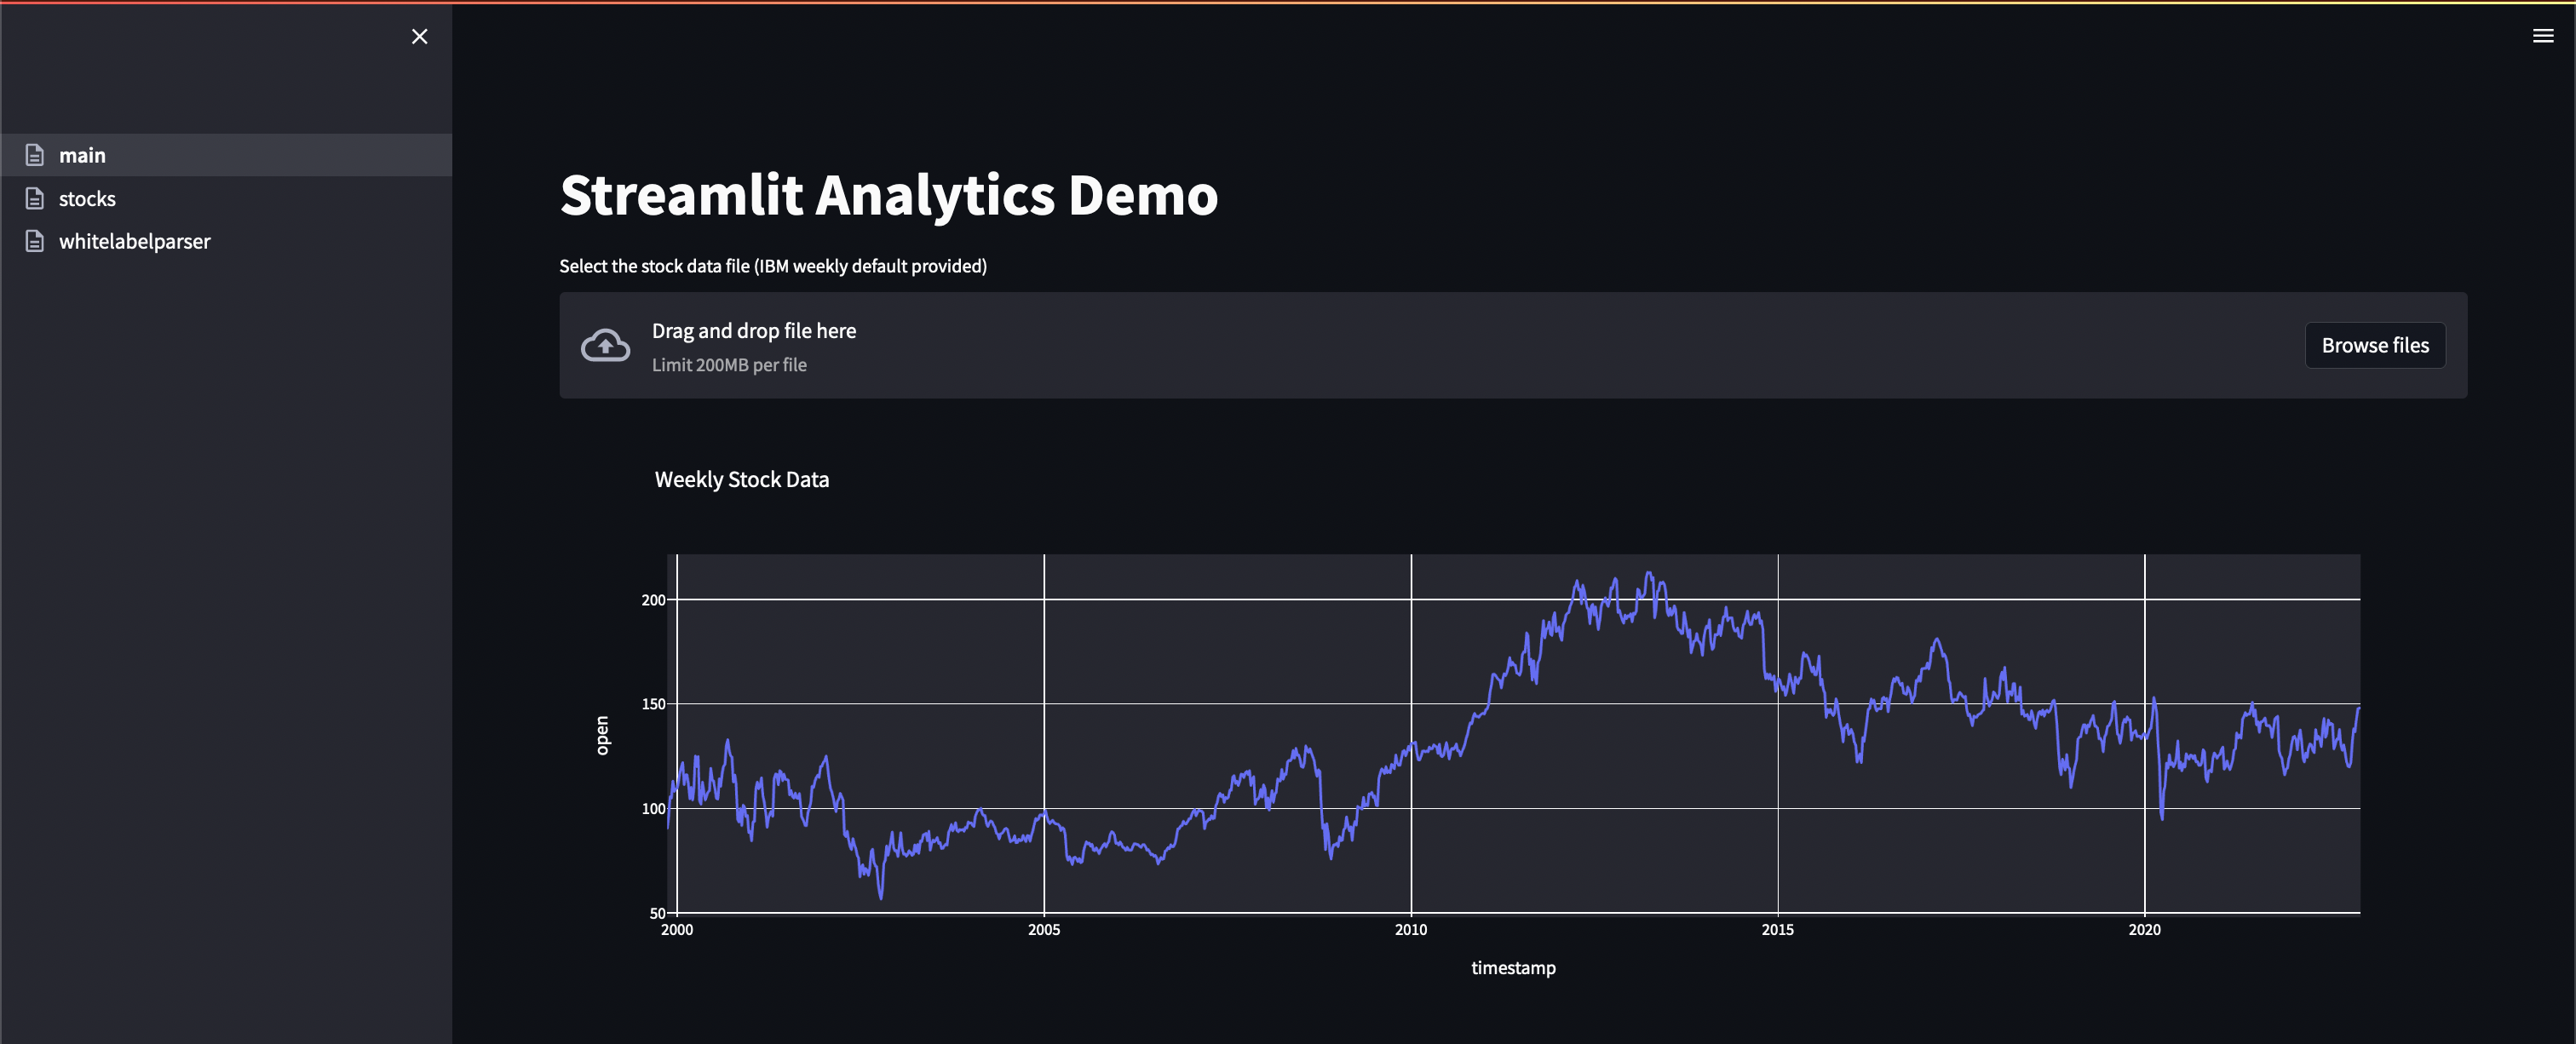
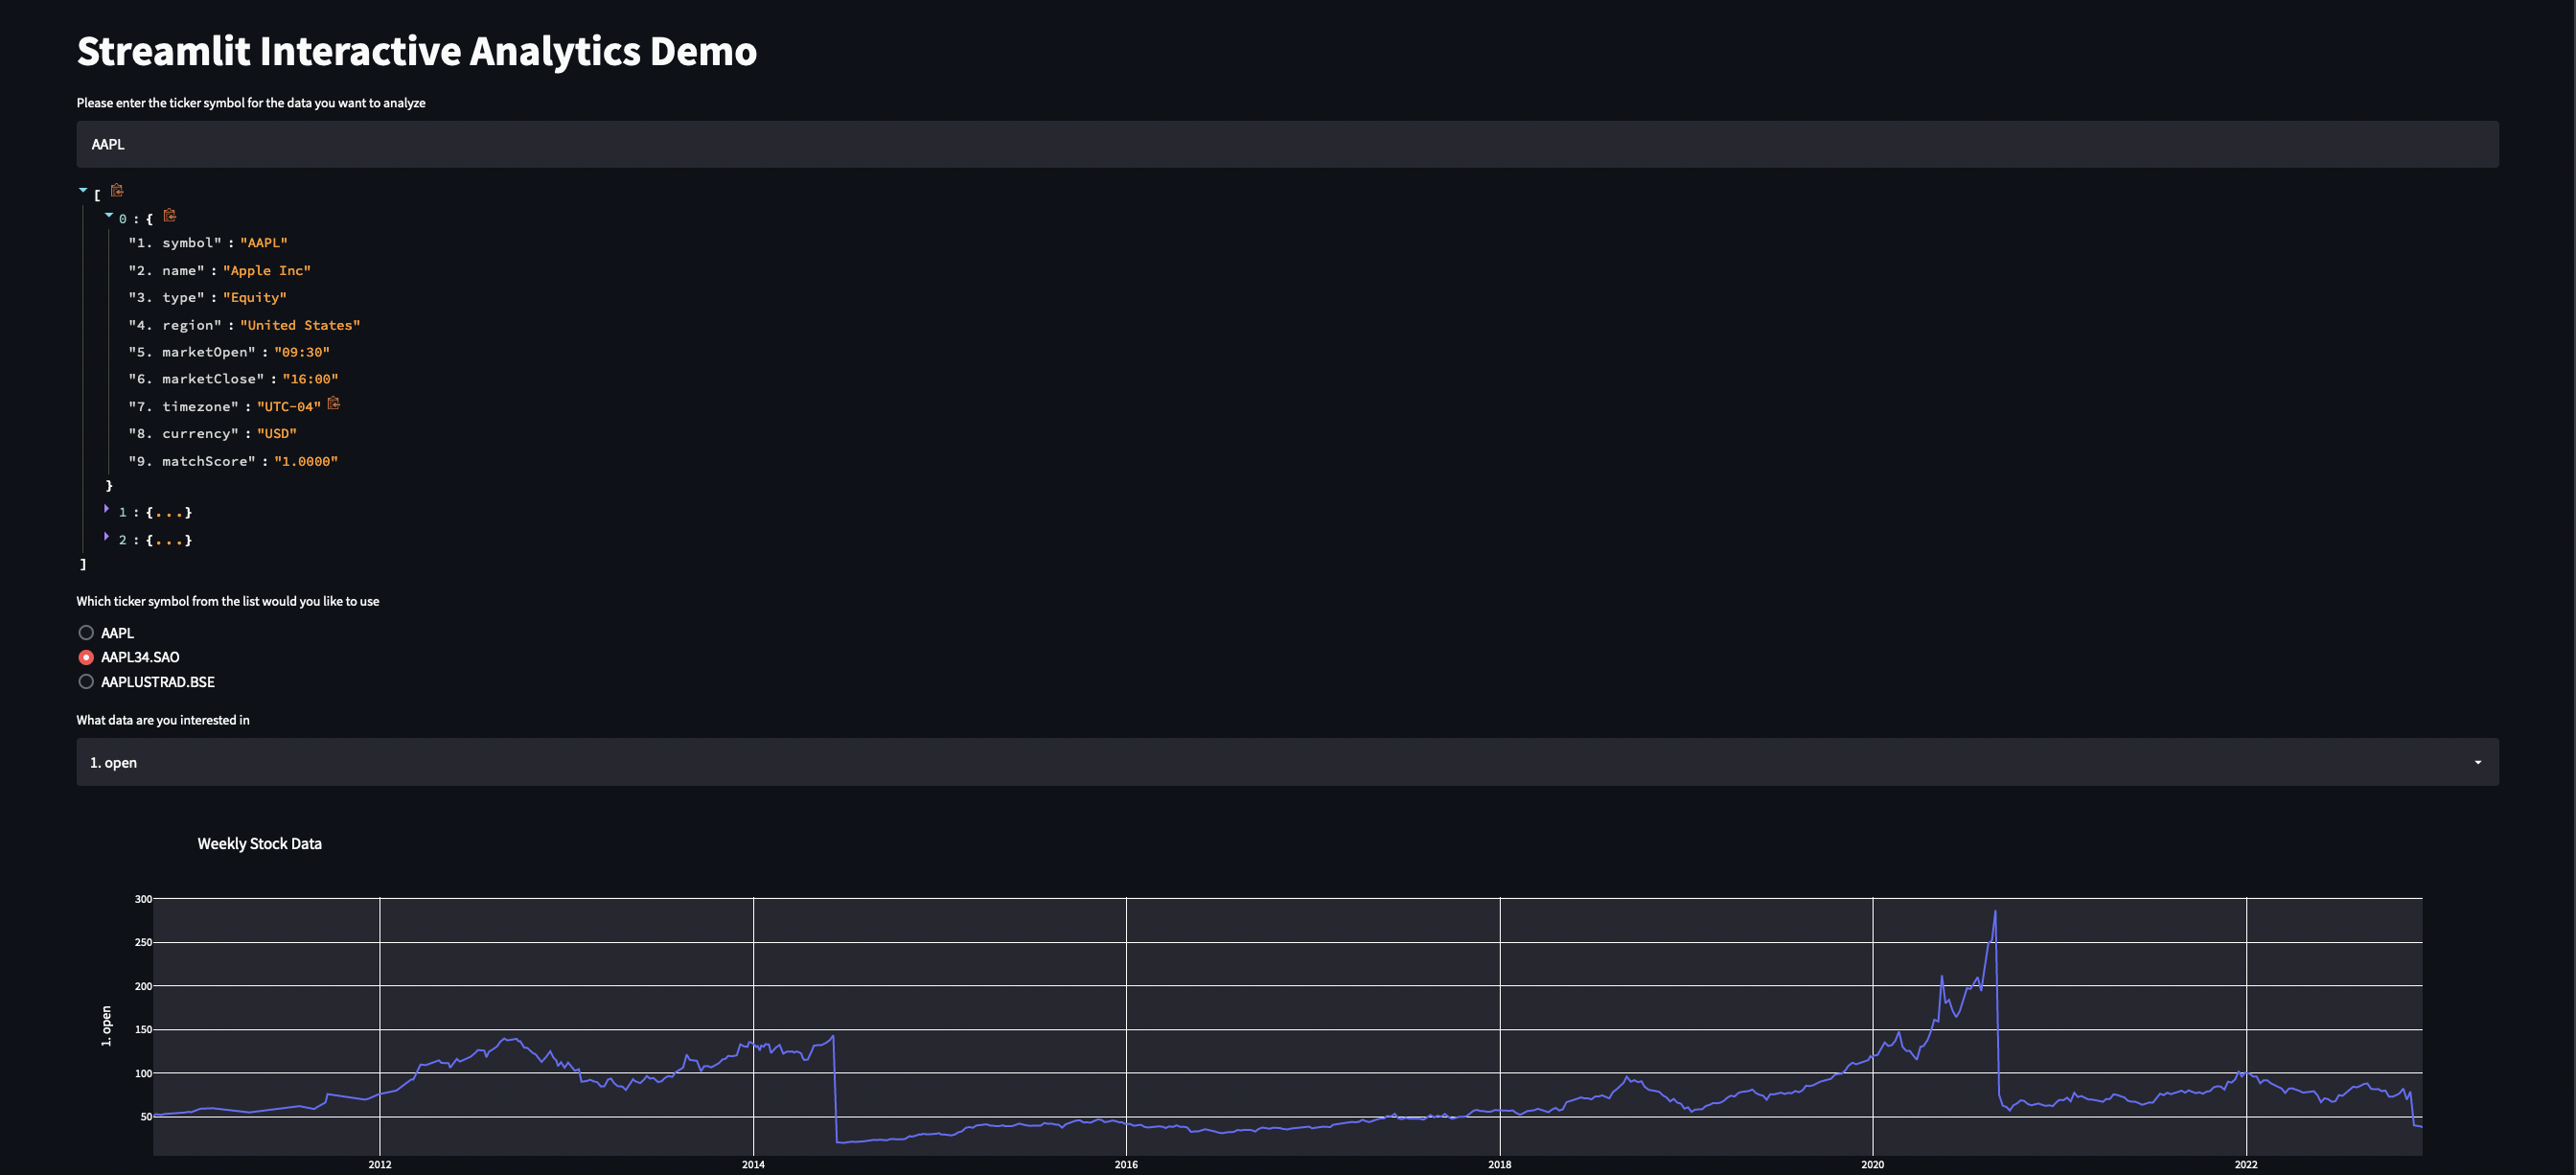
While the application mentioned above is not really meant for analysis (in the end its just a cool data wrangler and parser), Streamlit really thrives in the analysis and data viz space so I wanted to demo some of those capabilities as well. With that in mind, I built a self service interactive dashboard that illustrates some data discovery and analysis on a data source I found online. The data source can be found here, https://www.alphavantage.co/ and is an easy and free API that provides stock data by different categories (daily, weekly, etc). To use this source, you just have to register and receive an API key.
The first page of the app is very basic, using csv files that a user can upload to analyze certain data points around a specific stock. You can see the strength of the framework in just this first page, with a very small amount of code giving us some powerful capabilities off the jump (multi-page application, file uploading, etc).

However, this is still fairly basic. The second page builds on that a little bit more and queries an API as a data source as well as providing some interactivity for self service analysis. On this advanced page, a user can search for the company’s ticker symbol, see a result of the most likely results, and choose from those. Once the user has chosen the company they’re interested, they’re given the option of which data point they’d specifically like to visualize.

- Deploying with Docker
Finally, I also included a quick write up on deploying a Streamlit project with Docker (including my docker file since I know that’s what everyone googling Streamlit Docker is really looking for). While Streamlit offers their product, Streamlit Cloud, for easy deployments, my particular project needed an alternative for deployment. I ended up using Docker since that’s my go-to for just about anything and was quite happy with how easy it was to deploy. If you’re interested in creating a CI/CD pipeline for a Streamlit project, you can combine this Dockerfile with Github Actions (like in one of my previous posts).
FROM python:3.9-slim

EXPOSE 8501

WORKDIR /app


ADD DefaultValues/books.json /app/DefaultValues/books.json
ADD DefaultValues/weekly_IBM.csv /app/weekly_IBM.csv
COPY . .

RUN pip3 install xmlschema
RUN pip3 install streamlit
RUN pip3 install xml.etree.ElementTree as ET
RUN pip3 install numpy
RUN pip3 install plotly.express
RUN pip3 install matplotlib.pyplo

ENTRYPOINT ["streamlit", "run", "parseroutput.py", "--server.port=8501", "--server.address=0.0.0.0"]